

Thermal Control
Introduction
Thermal Control is an array cooling group control system designed by aBMC for array servers. The system consists of two modules: condition monitoring and temperature control.
- Monitoring module: Responsible for collecting array SOC temperature, fan real-time speed and other hardware thermal status information
- Temperature control module: Built-in three preset cooling strategies: silent, balanced (default), and powerful. It also opens the ability to customize temperature control configurations. Users can flexibly choose based on the computer room environment and computing power load.
Development Vision
- Provide users with a visual temperature chart to facilitate customers to adjust algorithm strength according to heat dissipation conditions
- Users can use the balanced heat dissipation strategy of the temperature control module to effectively prevent single-point thermal runaway in the array cluster.
Feature Usage
Set fan operating mode
Open the fan settings window
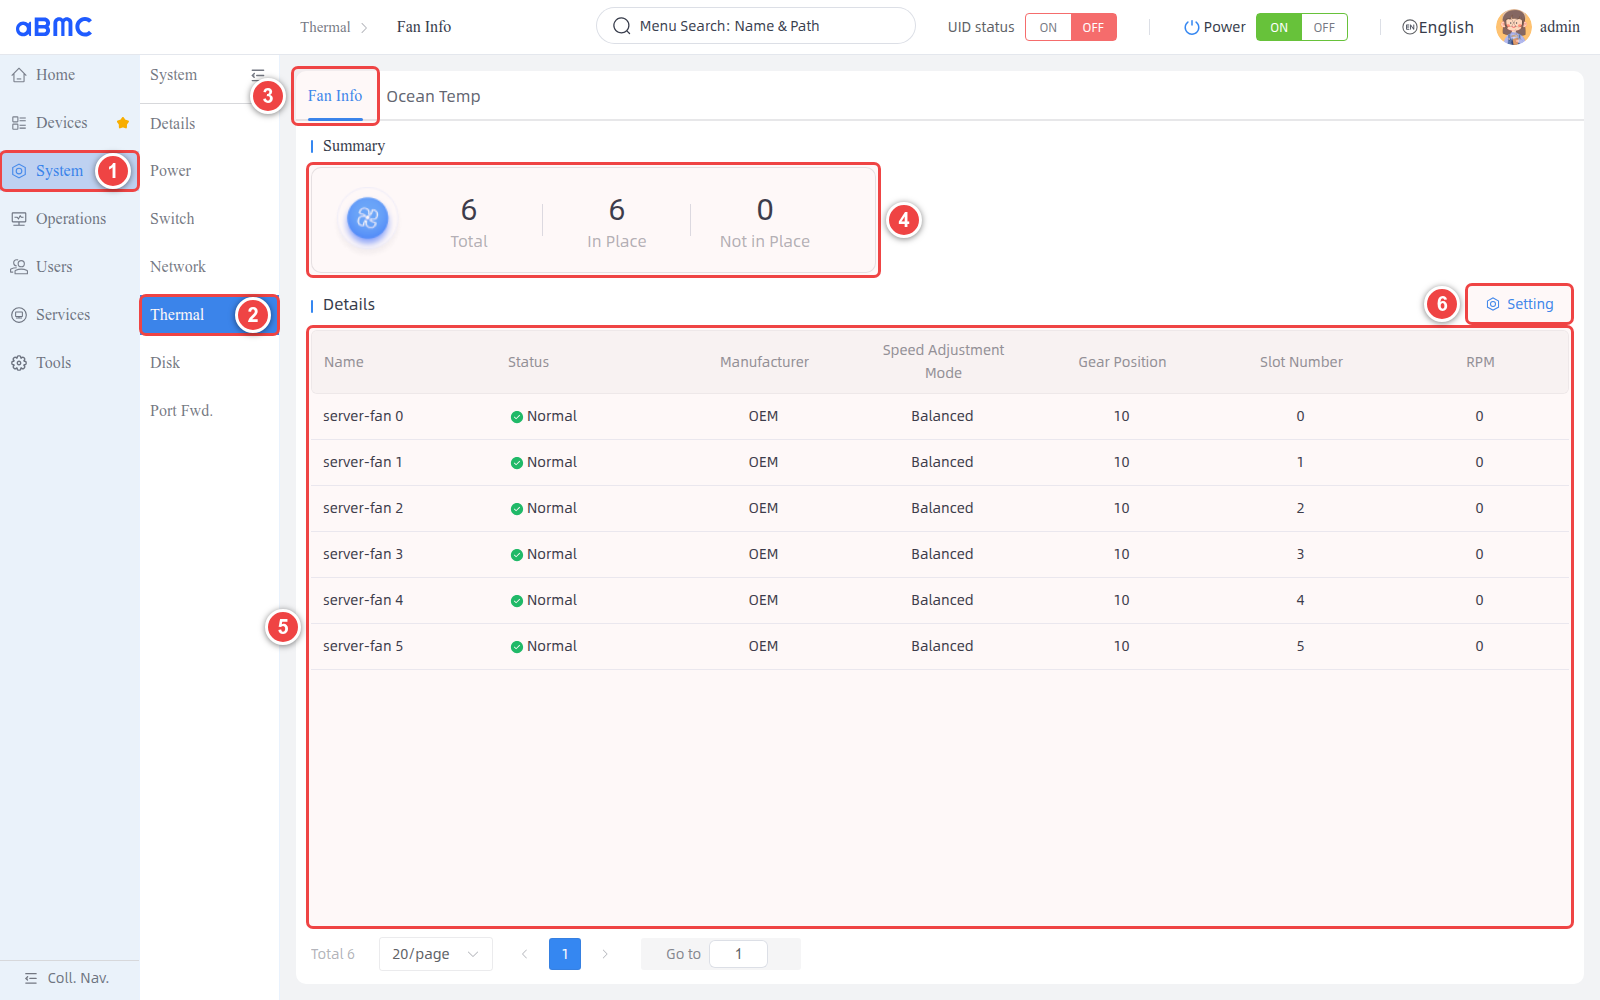
- Select System in the left navigation bar.
- Select Thermal in the secondary navigation bar
- Confirm the presence of the fan in the Summary of the Fan Info page.
- Check Status and RPM in Details.
- Click Setting to open the Fan Settings window.
Select fan operation mode
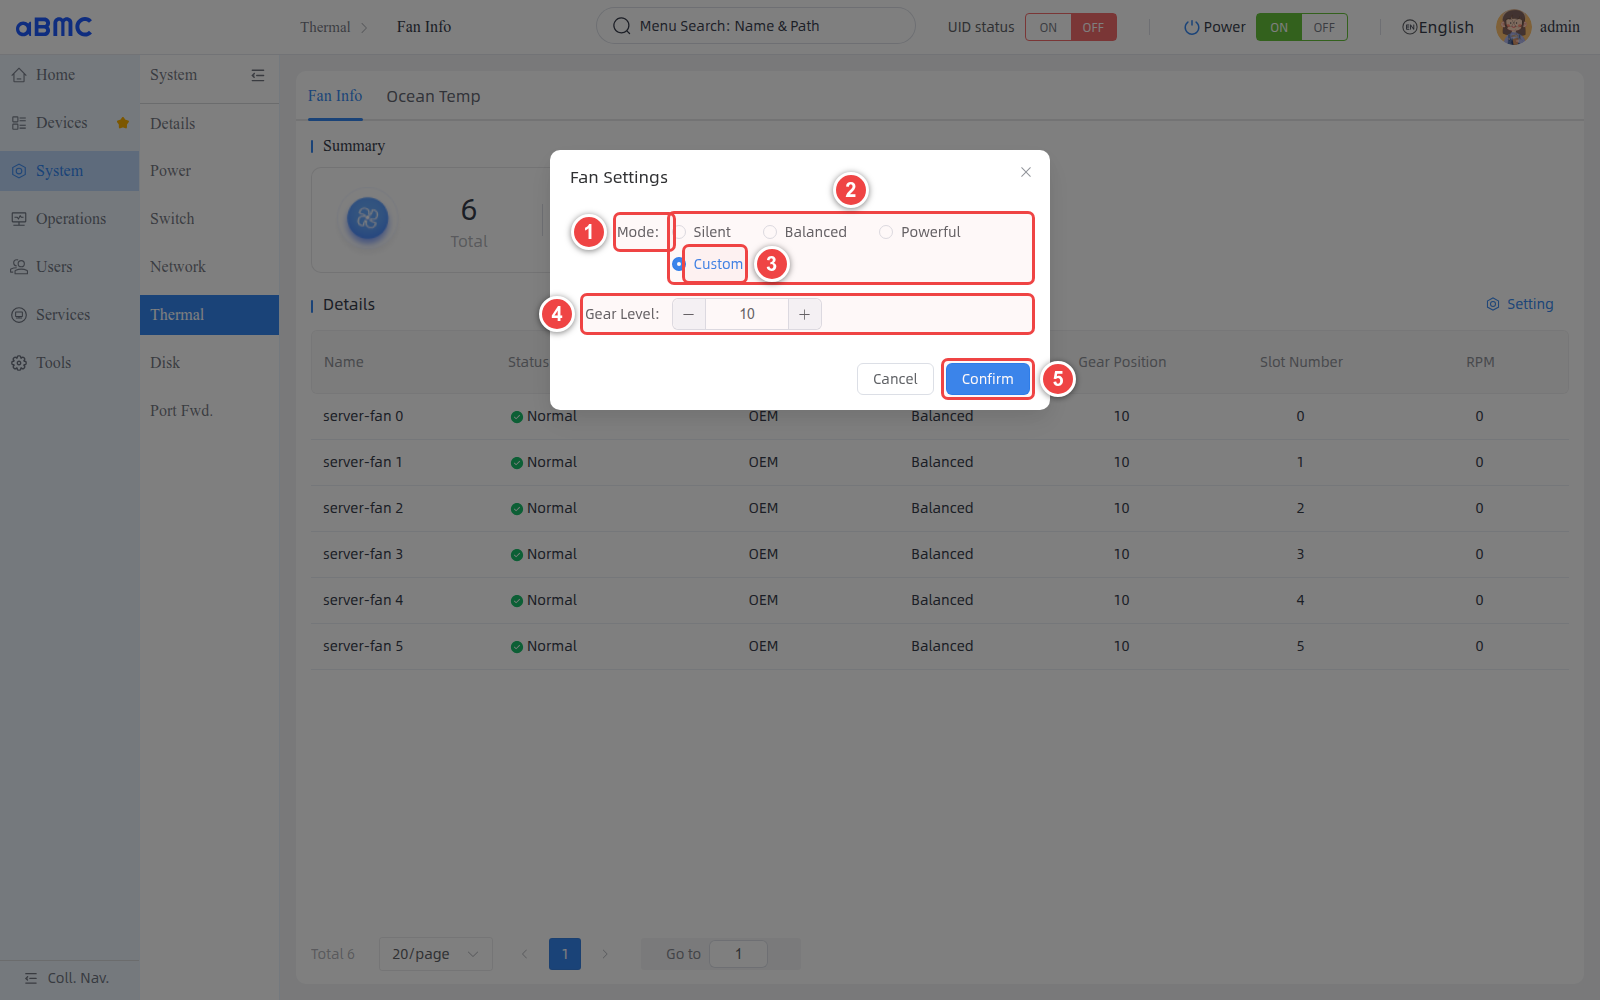
- Select Silent, Balanced, Powerful or Custom in Mode.
- When Custom is selected, enter an integer in the range
1–20in Gear Level. - After checking that the configuration is correct, click Confirm.
Confirm configuration result
Return to Fan Info, confirm that Speed Adjustment Mode has been updated, and continue to observe whether RPM and board temperature are as expected.
Mode selection suggestions
| Mode | Description | Usage Suggestions |
|---|---|---|
| Silent | Prioritize fan noise reduction. | Suitable for environments with low load and stable temperature. The temperature should be continuously observed after use. |
| Balanced | Maintains a balance between cooling capacity, power consumption, and noise. | Suitable as a common mode for general operating scenarios. |
| Powerful | Improve heat dissipation capacity. | Suitable for scenarios with high load or high temperature, where noise and power consumption may increase. |
| Custom | Control the fan using the specified Gear Level. | Use only if you know the thermal requirements of your device, temperature and RPM should be verified after setup. |
Custom mode description
The value range of Gear Level is 1–20. The correspondence between the gear, actual RPM, and heat dissipation effect is determined by the device, and the gear value does not represent the rotational speed percentage. After modification, you should continue to observe the fan speed and board temperature.
View Thermal Management Monitoring Charts
Open the temperature monitoring page
- Select System > Thermal in the left navigation bar.
- Click Ocean Temp at the top of the page.
- Wait for the device topology, temperature data, and trend graphs to finish loading.
View temperature topology
- View the current temperature and status identification of each collection point.
- When you need to adjust the view, use the topology controls to zoom, adapt or reset.
Configure temperature trend parameters
- Use Select Time Range to select the historical data range, for example Last 30 Min.
- Set the data sampling Step within the recommended range displayed in the input box.
- Select the auto-refresh interval, for example 15 Seconds.
- Click Refresh when you need to update the data immediately.
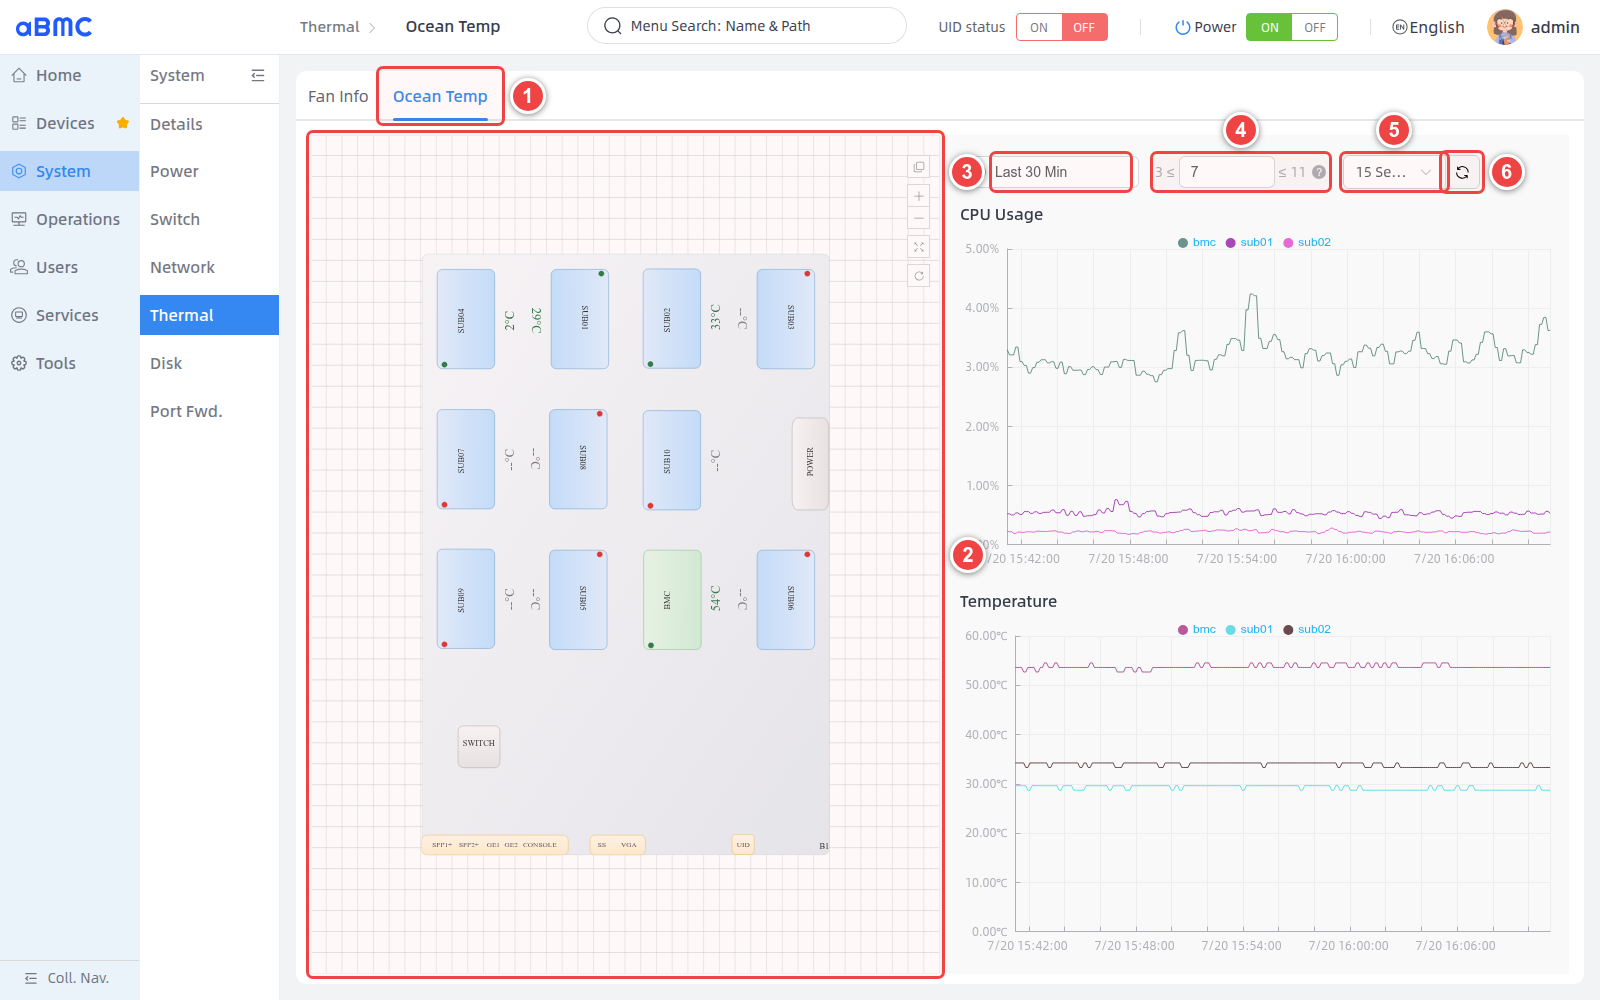
Confirm monitoring results
- Confirm that the temperature collection points in the device topology are displayed normally.
- Confirm that the time range and data density of the trend chart are as expected.
- After manual refresh or waiting for automatic refresh, confirm that the temperature data and status can be updated normally.
- If the collection point displays an abnormal state or the temperature continues to rise, further investigation should be conducted based on the fan RPM, current operating mode, and device alarms.
Temperature monitoring parameter description
| Parameter or area | Description | Usage requirements |
|---|---|---|
| Device Topology | Displays boards, interfaces, temperature values and status points according to the physical layout of the device. | Whether the temperature is normal should be determined based on device specifications, current load, and device alarms. |
| Select Time Range | Select the query time range for temperature trend data. | The larger the time range, the larger the sampling step size is recommended. |
| Step | Control the sampling interval of chart data. The smaller the value, the denser the data points, the larger the value, the sparser the data points. | must be within the system recommended range displayed on both sides of the input box. |
| Refresh Interval | Control the time interval at which the page automatically obtains the latest data. | Requests are more frequent when the interval is shorter and should be selected based on monitoring needs. |
| Refresh | Immediately reacquire temperature and status data. | If the data is not updated for a long time, it can be refreshed manually. |
| Topology Controls | Used to zoom, fit the view, or reset the topology. | Only affects the page view and does not change the device status. |
Sampling step description
Step is used to control the data sampling interval of the trend chart. The smaller the value, the denser the data points; the larger the value, the sparser the data points. The recommended interval given by the page based on the current time range should be used to avoid too many data points affecting query and rendering efficiency.
FAQ
Abnormal speed display
When the fan status is Normal but the RPM is 0, manually refresh and observe for a period of time, and combine the device alarms to determine whether the fan has stopped or data reading failed.
Trend data is too dense or too sparse
Adjust Step within the recommended range of the page. Use smaller values for short time ranges and larger values for long time ranges.